
New tool to visualize funding gaps for nutrition
How far does $10 get you? Two cups of coffee? A few metro rides? The World Bank estimates that $10 per child per year is enough to fund a package of lifesaving nutrition interventions to improve child nutrition globally and achieve the World Health Assembly targets for stunting, anemia, exclusive breastfeeding, and to treat acute malnutrition.
This will require a global investment of $70 billion above current spending over the next 10 years. In 2016, Results for Development (R4D) co-developed the Global Investment Framework for Nutrition, which provides fair-share financing scenarios for the various contributors and financial benchmarks that, if achieved, will help turn these aspirational global nutrition goals into landmark achievements by 2025. In the most ambitious ‘Global Solidarity’ scenario, donors would need to quickly and dramatically increase funding in the next five years; after that, donor funds would taper off and domestic low- and middle-income financing would ramp up.
To accelerate progress, domestic funding would need to increase 2.5-fold to an additional $4 billion per year and donor contributions would need to near quadruple to spend an additional $3 billion per year on average. These investments, while ambitious, are necessary to achieve the Sustainable Development Goals.
Launched last spring, the global investment framework helped fuel a rise in political commitment to nutrition. In October 2016, at the Human Capital Summit, nine countries from across the world committed to reduce childhood stunting by investing in children and early childhood development. Jim Kim, President of the World Bank, issued a call to end stunting and encouraged heads of state to fight malnutrition. Likewise, President Akinwumi Adesina of the African Development Bank supported African Leaders for Nutrition by declaring, “The greatest contributor to economic growth is not physical infrastructure, but brainpower: what I refer to as ‘grey matter infrastructure.’”
Now, the global community must get to work to ensure pledges to improve nutrition are backed by financial commitments and prioritization.
How data visualization can help
Too often, data that could enable evidence-based decision-making, improve coordination and promote accountability are buried in dense reports and complex spreadsheets. To maximize the utility of data, they need to be easy to find, understand and interact with. For instance, as the secretariat for the Governance Data Alliance, R4D helped bring various governance data sets together for the first time in one place by serving up easy-to-use online dashboards. Data Dashboards offer the option to search data by assessment, country and year, and to compare up to three countries across the various assessments.
That’s why R4D created InvestInNutrition.org. The website provides simple yet elegant visualizations that civil society organizations, advocates, development partners and government planners can use to access and review global, country- and region-specific financing information. Users can also print pages to generate in-hand reports and download data and powerful images to support nutrition advocacy and communication.
On InvestInNutrition.org, you can see how much it will cost each region and income group to achieve the global nutrition targets by 2025, and, in a scenario with constrained resources, how much it would cost the world to scale-up a priority package of the most cost-effective interventions. The global analysis suggests where the additional funding could come from. And information on current levels of funding available for the nutrition targets, estimated based on the most recent data years, is available by country.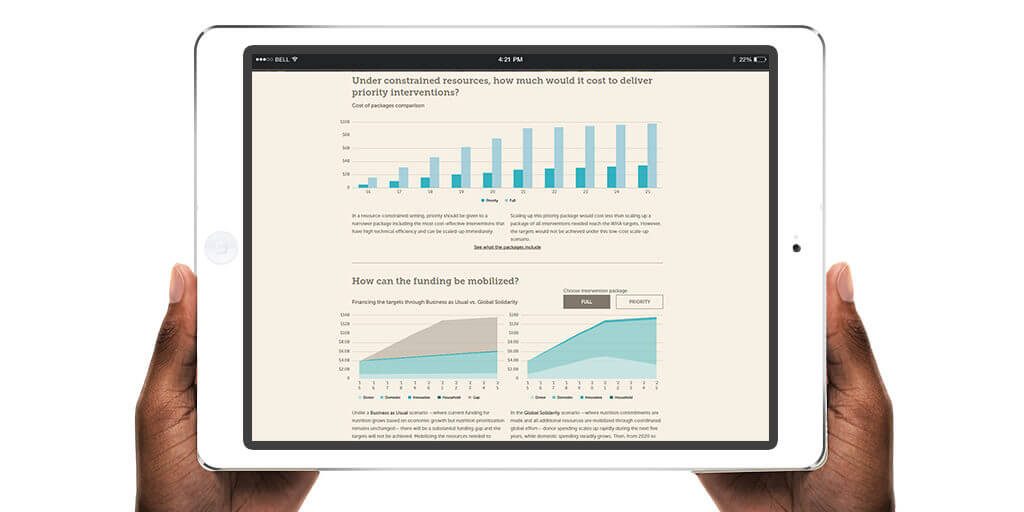
For example, by toggling on sub-Saharan Africa, the site shows the prevalence of nutritional conditions in the region and the cost to achieve the global nutrition targets over the next ten years. With regionally-tailored information, data and graphics can be used to support high-level regional initiatives such as the African Leaders for Nutrition champion group. The additional financing needs shown can be incorporated into region-specific advocacy strategies and used as a goal post for all partners and stakeholders in the region to collectively achieve by 2025.
The site also helps illustrate the necessary components to build an investment case for nutrition at the country level: a planned set of context-specific priority interventions, analysis of current funding available, annual cost estimates, impact assessment and financing options. These components are critical to help drive the nutrition policy agenda at country level within and across sectors.
What’s next?
Political commitment to nutrition is rising, and the Global Investment Framework has given the world financial benchmarks to aspire to. But how do we know if we’re making progress? R4D is dedicated to tracking financial commitments and disbursements for nutrition to monitor progress in support of global nutrition goals. We will work with the Scaling Up Nutrition Movement, development partners, NGOs and countries to ensure we are all on track to achieve our shared vision of better nutrition worldwide.
In the meantime, we need your help to spread the word and ensure that both countries and donors prioritize nutrition, back pledges with financial commitments, close the resource gap and save millions of lives.
Photos © Results for Development